Most contact centre dashboards track 40 numbers and act on three. That gap is where revenue leaks. Call centre metrics only earn their place if someone acts on them.
The teams that run lean operations do not track more metrics. They track fewer, with sharper definitions, and connect each one to the cost of every decision.
A two-minute drop in handle time only helps if it does not push repeat calls up. A 92% satisfaction score only helps if you understand why the other 8% left and never came back.
Does your dashboard actually tell you what to do on Monday? If not, it needs a rebuild.
What is a call centre metric actually supposed to do?
A call centre metric maps one observable event to a decision you can make about staffing, technology, routing, or process.
If a number cannot change a decision, it is reporting, not a metric.
The split between metrics and KPIs is practical. Metrics are raw measurements. KPIs are the small set tied directly to a business outcome the leadership team has committed to move this quarter.
A contact centre can have 50 metrics and four KPIs. Most have 50 and 50, and nothing gets fixed on Monday. Pick four to six KPIs per role. Keep the rest as diagnostic numbers, looked at only when a KPI moves.
Your dashboard should answer one question: what do I do differently on Monday? If it cannot answer that, it needs a rebuild.
Which call centre metrics predict whether customers come back?
These are the lagging signals of everything else happening in your operation. Track them at the segment level, not just the average.
Customer Satisfaction Score
CSAT measures the share of callers who rated an interaction positively, typically the top two options on a five-point scale.
Formula: (positive responses / total responses) x 100.
The average is not very useful. Slice by call type, agent tenure, time of day, and issue category. The bottom decile of your CSAT distribution explains more than the mean ever will.
Survey within 60 seconds of call end and ask one question. Response rates drop sharply beyond 90 seconds and beyond two questions. Trust the score only once you have at least 25% response rate.
Net Promoter Score
NPS measures whether customers would recommend your business. It is a brand-level signal, not a call-level one.
Formula: % promoters (scoring 9-10) minus % detractors (scoring 0-6).
Use NPS for quarterly trend lines, not real time coaching. A five-point drop almost always traces to a specific operational change. Read every detractor verbatim from the last 30 days before you spend a meeting debating tactics.
Customer Effort Score
CES asks how hard your caller had to work to get their problem solved. Research consistently shows effort predicts loyalty better than satisfaction for service interactions. Customers forget pleasant calls but remember painful ones.
Formula: sum of effort ratings / number of responses.
Anything above a 4 on a 7-point scale is a friction problem. The fix is rarely better training. It is usually too many transfers, routing that misses caller intent, or a knowledge base agents cannot search under pressure.
Your AI agent removes most of those friction points before a human is ever involved. It routes on intent from the first sentence, not from a menu selection.
First Call Resolution
FCR is the share of your issues solved on the first contact, with no callback or escalation required.
Formula: contacts resolved first time / total contacts x 100.
Measure with a 7-day or 14-day window. If the same caller rings back about the same issue inside that window, the original contact did not resolve it. Agent self-reporting at call end inflates FCR by 15 to 20 percentage points. Use the windowed version or do not bother tracking it.
Industry median FCR sits around 70 to 75%. Below 65% means your knowledge base, routing, or training is failing. An AI agent with a live RAG knowledge base resolves the routine 70% without human involvement. That raises your human team's FCR because they only take calls that genuinely need them.
Repeat Call Rate
Repeat call rate is the inverse of FCR: the share of callers who ring back within your measurement window.
Formula: repeat calls / total calls x 100.
Watch this alongside FCR, not instead of it. A campaign that drives new contacts can move total call volume without changing repeat rate. FCR tells you if you solved it; repeat rate tells you how often you did not.
What are the core cost metrics every operator should track?
Cost metrics are where AI voice agents change the maths most visibly. Your decisions here determine whether a campaign pencils or does not.
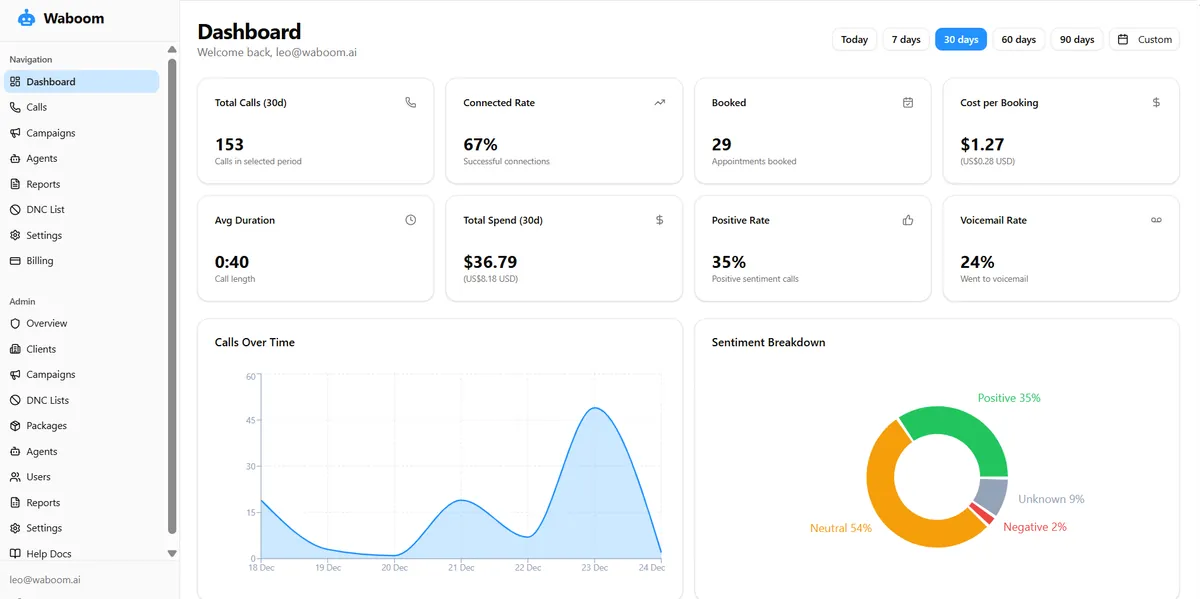
One screen in the Waboom AI portal: connect rate, cost per booking, spend and sentiment for any date range.
Cost Per Call
Cost per call divides your total contact centre spend by the number of calls handled in the same period.
Formula: total operating cost / total calls handled.
In our 90-day Sydney outbound campaign, 9,856 dials cost $0.43 per call. A human team running the same volume costs roughly eight to twelve times that figure. That is the difference between a campaign that pencils and one that does not.
See the full Philippines vs AI maths here. Your cost per call is the first number to benchmark before you scale anything.
Cost Per Conversation
Cost per call is a volume metric. Cost per conversation measures only calls where a real exchange happened, typically a connected call lasting 30 seconds or more.
Formula: total campaign cost / conversations (calls >=30s).
In the same Sydney campaign, cost per conversation landed at $2.31. That is the true unit of work. Anything that improves your connect rate or conversation rate reduces this figure without changing anything else.
Cost Per Outcome
Cost per outcome divides total spend by outcomes achieved. An outcome is your defined goal: a warm transfer, a booked appointment, a confirmed sale.
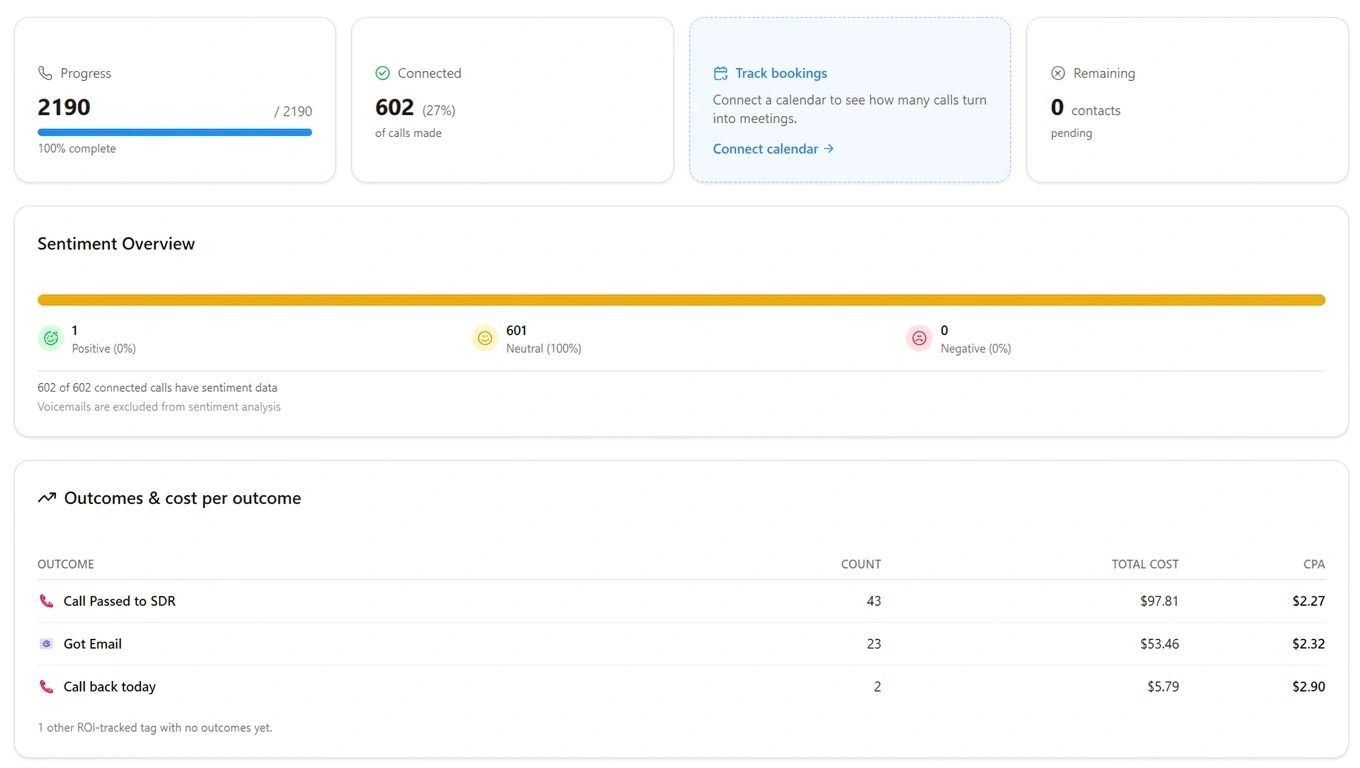
Cost per outcome, broken down by tag, straight from the portal.
Formula: total cost / outcomes achieved.
In Sydney, the campaign delivered 141 warm-transferred sellers at $32.74 each. In Christchurch, property viewings came in at $7.12 per booked viewing. Those are the numbers your CFO can read. Full Sydney campaign breakdown here.
Average Handle Time
AHT covers the full duration of an interaction: talk time plus any after-call work.
Formula: (total talk time + hold time + after-call work) / total calls.
A lower AHT only helps if your FCR holds or improves. Cutting two minutes off AHT while repeat calls climb 8% is a false saving. AI agents have near-zero after-call work because outcomes, tags, and notes write automatically during the call.
Occupancy Rate
Occupancy measures how much of your human agent's logged-in time is spent on active work.
Formula: (talk time + after-call work) / total logged-in time x 100.
Target 80 to 85%. Below 70% means you are paying for idle time. Above 90% means agents are burning out and quality will drop before your CSAT scores catch it.
An AI agent changes this calculation entirely. It does not have idle time, burnout thresholds, or adherence drift. You pay per minute of talk time, not per hour of availability.
How do you measure whether your inbound queue is working?
These metrics tell you whether callers are getting through, waiting too long, or giving up before they speak to anyone.
Service Level
Service level is the percentage of calls answered within a defined threshold, typically 80% of calls answered within 20 seconds.
Formula: calls answered within threshold / total calls offered x 100.
The 80/20 standard is common but not universal. Match your threshold to your industry and caller expectations. After hours or overflow traffic has different tolerances than inbound sales lines.
An AI agent answers in under a second. Service level for AI-handled calls is always 100%. The question becomes whether your routing logic sends the right calls to the agent versus your human team.
Average Speed of Answer
ASA measures the average time callers wait before the first response.
Formula: total hold time for answered calls / total answered calls.
ASA below 30 seconds is the standard most businesses aim for. Every second above that costs you caller patience.
An Auckland hotel shifted after-hours calls to an AI agent. Bookings rose 47%. The agent answered immediately instead of going to voicemail. Full story here.
Abandonment Rate
Abandonment rate is the percentage of your callers who hang up before reaching anyone.
Formula: abandoned calls / (answered calls + abandoned calls) x 100.
The industry average sits around 5 to 8%. Above 10% means your queue is actively driving customers away. A Dunedin property manager was losing 300 calls a month: callers who gave up and rang a competitor. That story is here.
Every abandoned call is a lead that self-selected out. Your abandonment rate is almost certainly higher after hours than during business hours.
After Hours Missed Call Rate
This metric is rarely on standard dashboards. It should be on your dashboard.
Formula: calls received outside business hours that went unanswered / total calls received x 100.
A Hamilton home care agency calculated $641,000 a year lost to missed after-hours enquiries. An Auckland mechanic missed 463 after-hours calls in a single year. Neither business knew the number until they measured it.
What call centre metrics matter most for outbound campaigns?
Outbound has its own set of leading indicators. These are the numbers the Waboom AI portal surfaces in real time during your campaign.
Connect Rate
Connect rate is the share of your dials that reach a real person.
Formula: human pickups / total dials x 100.
In the Sydney 90-day campaign, 9,856 dials returned a 33.7% human pickup rate. That number is not fixed. Time of day, day of week, number reputation, and list quality all shift it.
Your connect rate is the first lever to pull. Check your peak time data before locking in your next campaign schedule. Move density to your highest-pickup windows and connect rate climbs before you touch a single script line.
Conversation Rate
Conversation rate measures the share of your dials that produced a genuine exchange, typically a call lasting 30 seconds or more.
Formula: conversations (>=30s) / total dials x 100.
In the Sydney campaign, conversation rate hit 20.3%. This is the metric that separates a quality list from a burned one. A high connect rate paired with a low conversation rate points to a number reputation problem or a bad opening line.
See the full outbound KPI breakdown here to understand how your conversation rate fits into your broader campaign picture.
Warm Transfer Rate
Warm transfer rate measures the share of conversations that result in a hand-off to a human team member.
Formula: warm transfers / total conversations x 100.
In Sydney, 7.1% of conversations converted to warm transfers, delivering 141 qualified seller leads directly to agents. Your human team picks up a call knowing who is speaking and why. How warm transfer with context works here.
Outcome Rate
Outcome rate is the broadest conversion metric: the share of all dials that produced your defined goal.
Formula: outcomes / total dials x 100.
In Christchurch, 5.3% of dials produced a booked property viewing. That is a hard operational number a developer can build a campaign budget around. Your own pilot baseline beats any industry average.
Peak Time Distribution
This is not a ratio. It is a pattern. The Waboom AI portal shows which hours and days produced the highest conversation rates across your campaign.
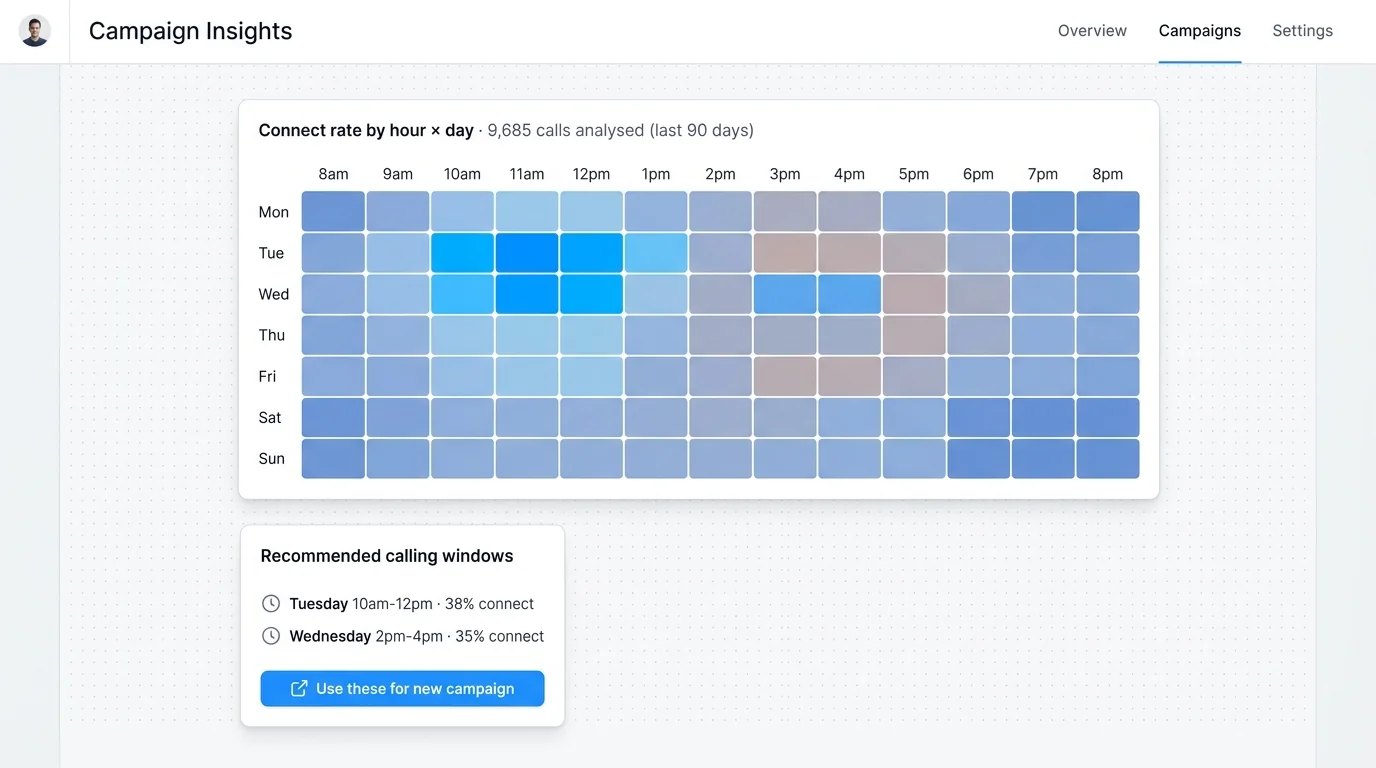
Connect rate by hour and day, with the portal recommending your best calling windows.
A campaign that dials evenly across a day wastes budget on low-pickup windows. Move density to your top-performing windows and connect rate climbs without a single script change. Your peak time data is available live in the portal dashboard.
Campaign Cost Per Outcome
This collapses all campaign spend into the unit that matters: the cost of one achieved goal.
Formula: total campaign cost / total outcomes.
$32.74 per warm-transferred seller in Sydney. $7.12 per booked viewing in Christchurch. Those are the benchmarks to beat in your next campaign. Run your own pilot first so you have a baseline that reflects your market.
How do you track AI agent quality separately from human quality?
An AI agent and a human agent are not measured the same way. The inputs differ, and so do the failure modes. Your QA process needs to reflect that.
Knowledge Base Hit Rate
This measures how often the agent found a relevant answer in your knowledge base versus falling back to a generic response.
A low hit rate means your knowledge base has gaps. Update your documents and the change lands on the very next call. How real time knowledge base updates work here.
Your knowledge base is your agent's brain. Gaps there show up directly in this number. Check it in the first two weeks of any new deployment.
Hallucination Rate
Hallucination rate tracks the share of calls where the agent stated something not supported by your knowledge base or instructions.
This requires QA review or automated scoring against transcripts. Target zero. A voice agent that invents facts is a liability, not a tool.
Check your transcripts in the first two weeks of any new agent deployment. Catching a hallucination pattern early is far cheaper than correcting a reputation problem later.
Latency (First Token)
Latency measures the time between the caller finishing a sentence and the agent starting its response.
Waboom AI agents answer in under a second. Sub-800ms first token is the standard we hold. Callers hear a pause longer than one second as hesitation, and hesitation reads as incompetence on the phone.
Check your latency figures in the first week of any new agent deployment. A problem caught in week one costs far less to fix than one discovered after callers have already formed a negative impression.
Barge In Handling Rate
This measures how often the agent correctly handles a caller interruption. The agent stops mid-sentence and responds to what the caller said, rather than finishing its own line.
A high barge in failure rate tells you the agent sounds robotic. Check this metric in your first 50 calls on any new agent. Your portal call recordings make that review straightforward.
Disclosure Compliance Rate
Every call an AI agent handles must include an AI disclosure. Disclosure compliance rate is the share of calls where that disclosure fired correctly.
This should be 100%. The Waboom AI platform fires the disclosure on every call by design. It is not a setting you can accidentally turn off.
Your compliance rate is visible in the portal. If it ever drops below 100%, the first place to check is your agent's opening sequence.
What are the most common mistakes when building a call centre metrics dashboard?
The dashboard mistakes are consistent across industries and team sizes. Avoiding them saves you weeks of misdiagnosis. Ask yourself whether your current setup falls into any of these traps.
Treating every tile as equally important. If 40 numbers get equal airtime in the Monday review, nothing gets fixed. You need a tiered structure: four to six KPIs per role, everything else as diagnostic.
Averaging across contexts that are not comparable. A CSAT score averaged across inbound billing calls and inbound sales calls tells you nothing about either. Segment before you average.
Measuring inputs instead of outcomes. Call volume is an input. Cost per outcome is an output. Dashboards filled with inputs are activity reports, not performance dashboards. Ask yourself: does this number tell me what to do, or just what happened?
Ignoring what happens after hours. Every missed after-hours call is invisible to a standard dashboard. Build a specific metric for it. The Hamilton and Auckland cases above make the cost of that blind spot concrete. Your after-hours rate is almost certainly worse than you think.
Benchmarking against industry averages instead of your own baseline. An industry average for cost per call ignores your market, your list, and your product. Run a pilot, establish your own baseline, then beat it. The New Zealand Privacy Commissioner's guidance on data handling is worth reading before you scale outbound. So is the Australian Competition and Consumer Commission's telemarketing rules.
Frequently Asked Questions
What is the single most important call centre metric to track?
First Call Resolution. It predicts both cost and customer satisfaction better than any other single number. If you resolve the issue on the first contact, almost every other metric improves as a downstream effect.
How does an AI voice agent change my cost per call?
Dramatically. In Waboom AI's 90-day Sydney outbound campaign, cost per call was $0.43 and cost per conversation was $2.31. A human team running the same volume costs eight to twelve times more per call. The AI handles volume; your human team handles the warm-transferred outcomes.
How do I measure AI agent quality on the Waboom AI portal?
The portal surfaces conversation rate, warm transfer rate, cost per outcome, call tags, and peak time distribution in real time during a campaign. Post-call analysis and call tags let you QA individual calls. Knowledge base hit rate and hallucination rate require transcript review, which the portal supports.
What is a good conversation rate for an AI outbound campaign?
Waboom AI's Sydney 90-day benchmark was 20.3% of dials producing a 30-second-plus conversation, from a 33.7% human pickup rate. Your rate depends on list quality, call timing, and opening line. Run 60 calls as a pilot before scaling to establish your own baseline.
Should I track NPS at the call level or the account level?
Track NPS at the account level, as a quarterly trend. NPS is a brand-level signal, not a call-level one. Use CSAT and CES at the call level for real time coaching. Reserve NPS for identifying whether a process change hurt loyalty across your customer base.
What happens to after hours metrics when I add an AI receptionist?
Your missed call rate for after-hours traffic drops to near zero. An Auckland hotel saw 47% more after-hours bookings after deploying an AI agent. The agent answered immediately rather than sending callers to voicemail. Track after-hours answer rate and after-hours conversion rate as separate metrics from your business-hours figures.
Leonardo Garcia-Curtis
Founder & CEO at Waboom AI. Building voice AI agents that convert.
Ready to Build Your AI Voice Agent?
Let's discuss how Waboom AI can help automate your customer conversations.
Book a Free Demo